 Mobile
 PC
PC
 Full-Cycle
 Co-Development
 Outstaffing
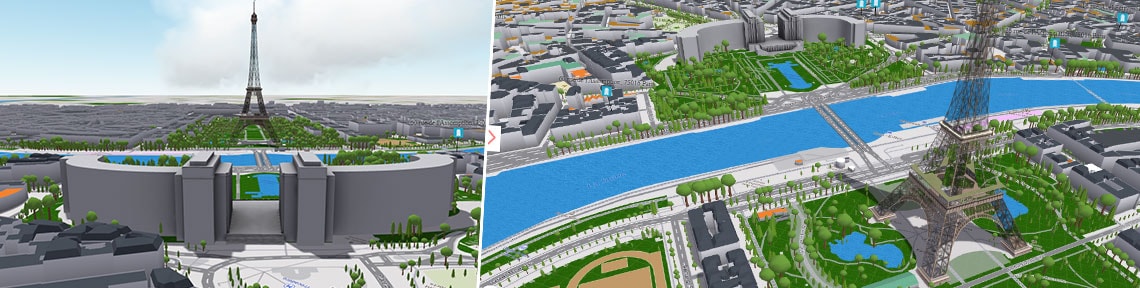
TECHNOLOGIES
WebGL, Shaders , Javascript, Three.js
Juego Studios built a Data Visualization Framework Analytics company in Europe to create a dynamic 2D and 3D mapping platform. With AR and VR integration that provides real-time information, the application is aimed at showcasing the overall quality, accuracy & depth on data information visually at runtime.
Data Visualization Overview
We created a dynamic geo-mapped data visualisation system that provides an accurate 3D dimensional representation of any given urban area with roads, trees, buildings, street elements etc based on the data plugged in. Clicking on an element, say a building or trees will show stats and collected information such as occupancy, size etc. 360 degree videos of street views can also be generated to get better picture of each area.
Additionally, we included a simulation of daylight, rain, snow effects etc to see how any area looks at different times of the year. We integrated the facility to export a scene for 3D printing to allow the creation of realistic physical models of any given area.
For the visualization, a 2D raster layer is first generated using our custom 2D raster server. The 3D layer containing elements like buildings, trees, roofs, electric poles, fences and other features is then generated on top of this layer. One of the key features of this tool is the amount of detail and accuracy in representation – for example, all important components including buildings, roads and even individual roof profile are rendered exactly according to the data, without approximation.
Each component is procedurally drawn, based on input data. This ensures a greater level of accuracy and detail. We restricted approximation to generic elements like traffic lights, electrical poles etc, which are modelled. Elements on the map are customizable at run-time and users can get clarity of IOT data to the generated 3D map.
The complete experience can also be rendered on virtual reality with different devices.
Key Features:
- Real-time Geo-Mapping data visualization with a high level of detail and accuracy – 2D and 3D Options
- 3D representations of urban areas with roads, trees, landscape, buildings, Daylight Mode, Roofs & Windows generated at runtime, 100+ different types of Raster etc.
- 360-degree videos
- Interactive 3D Maps
- Customization Elements
- 3D printing
- VR and AR experiences
Why work with us:
- A team of certified Javascript and WebGL developers. We have extensive experience in developing applications based on these technologies. We have therefore imbued the gamifying process into app building and making experiences more wholesome.
- Worked with ranging startups to Fortune 500 companies.
- As a premier game development company, we know much about data visualization, which pertains to presenting data in a more understandable and engaging form. This is an important process in big data technology, which we also pioneer in.
- Our standards are on par with the best data visualization companies in the industry.
ABOUT JUEGO

+
Team

+
Apps & Games

+
Years in Market

+
Client