 Mobile
 PC
PC
 Full-Cycle
 Co-Development
 Outstaffing


-
 Game Development
 Feb 9th, 2026
- Share:
Table of Contents
- Why Retention Fails in Good Games
- The Core Retention Metrics That Matter
- Genre Benchmarks: What "Good" Actually Means
- Player Behavior Patterns Behind These Metrics
- Mechanics That Move Each Metric
- LiveOps: Keeping the Game Alive
- Common Mistakes Studios Make
- How Retention Is Engineered in Production Pipelines
- Conclusion
Most studios don’t have a retention problem. They have a measurement problem.
They track DAU, installs, and revenue — but ignore the behavioral metrics that actually predict whether players will return tomorrow. The result? Teams pour resources into fixing the wrong problems while the real retention killers go unnoticed.
The industry data is stark: the median mobile game retention rate 1% of players by Day 30. Even top-tier games struggle to keep 4% of their player base after a month. Yet when studios see these numbers, they often react with band-aid solutions — more content drops, aggressive promotions, and blame shifted to marketing. These efforts miss the mark because they treat symptoms rather than root causes.
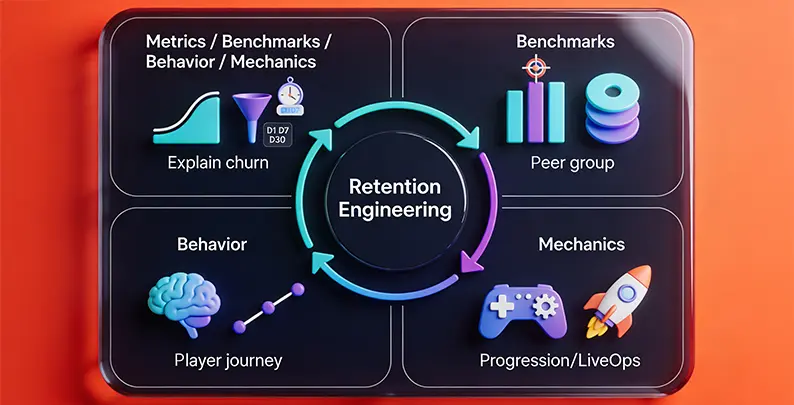
To thrive, a game development studio must move beyond guesswork. What separates games that succeed from those that hemorrhage players is a systematic approach built on four pillars: Metrics, Benchmarks, Behavior, and Mechanics. This blog talks about how this framework transforms game retention from a hopeful outcome into a disciplined engineering process.
Retention is designed, not discovered. Our game design and live ops teams help you build the systems — progression, social, rewards — that keep players coming back.
Why Retention Fails in Good Games
Great gameplay does not guarantee a loyal audience. Understanding why players leave reveals the structural issues that data alone cannot explain.
- The Critical First Impression: Most games lose the majority of new players within the first 1–3 days. If the onboarding process is too long, confusing, or boring, players churn before they experience the core “fun” of the game. This affects everything from skill-based games to narrative-driven experiences. As Space Ape Games co-founder Simon Hade warns, “Misdiagnosing why a game is successful, or spending years naively improving on something that is not broken, is a very common mistake.”
- Audience Misalignment: Marketing a hardcore strategy game to casual puzzle fans creates an immediate retention disaster. Understanding 3D game genres and their unique player expectations is critical. Studios often blame “short attention spans,” but the real culprit is an acquisition strategy that pulls in players who were never going to stick.
- Mid-Game Monotony: No matter how compelling the core mechanic, players will tire of it if it never evolves. Games with strong Day 1 retention but collapsing Day 7 numbers are often suffering from “content exhaustion.” Players exhaust the initial novelty by Day 3 and find themselves asking, “Is that all there is?” This is where effective game retention mechanics become essential.
- Monetization Missteps and Social Deficits: Pay-to-win perceptions, constant purchase pressure, or paywalls that leave non-payers with nothing to do will drive players away. A well-planned game monetization strategy balances revenue with player satisfaction. Trust, once broken by predatory monetization, rarely recovers. Furthermore, games without social features like guilds or community hubs make it easier for players to leave because no one notices their absence.
The Core Retention Metrics That Matter
To improve your game, you must first define your metrics concisely and avoid repeating definitions unnecessarily. Retention rate is the percentage of players who return after a given time period.
- Day 1 Retention (D1): This measures the strength of the first-time user experience (FTUE). It sets the upper limit for all downstream metrics; if 80% of players vanish on Day 1, your Day 7 cannot mathematically exceed 20%.
- Day 7 Retention (D7): This gauges mid-term engagement. It answers whether players are finding enough depth, challenge, and reward to keep playing past the initial novelty.
- Day 30 Retention (D30): This represents true long-term hooks. Players reaching this milestone have integrated the game into their daily routine. In free-to-play titles, D30 is the most accurate predictor of lifetime value (LTV).
Beyond these, teams should track “stickiness” (DAU/MAU), session frequency, and specific churn points within the tutorial to identify exactly where the “sieve” is leaking. Monitoring the game app retention rate across these dimensions provides a complete picture of player engagement.
Genre Benchmarks: What "Good" Actually Means
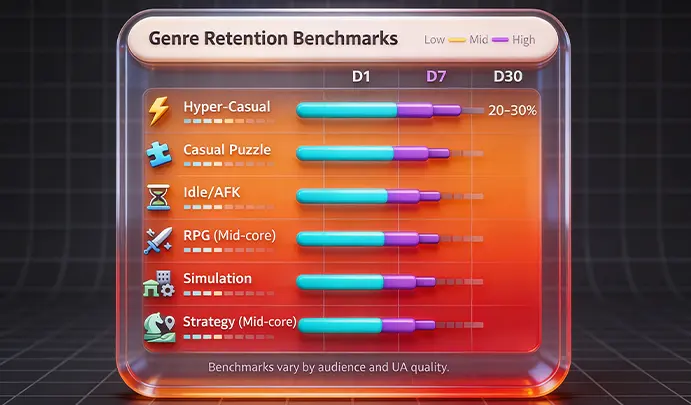
Benchmarks provide the necessary context for your numbers. For example, a 25% Day 1 retention may seem decent in a vacuum, but if the industry average for your genre is 40%, your game is underperforming. Understanding mobile game retention benchmarks is essential for setting realistic targets.
Genre Retention Benchmarks:
| Game Genre | Day 1 (D1) | Day 7 (D7) | Day 30 (D30) | Key Notes |
| Hyper-Casual | 20–30% | 5–10% | < 2% | High churn by design; ad-driven model |
| Casual Puzzle | 30–40% | 10–20% | 3–7% | Strong early retention; broad appeal |
| Idle/AFK | 35–50% | 20–30% | 10–15% | Passive gameplay extends retention |
| RPG (Mid-core) | 40–60% | 25–40% | 15–25% | Deep systems reward investment |
| Simulation | 45–60% | 30–45% | 20–30% | Highest overall retention; engaged players |
| Strategy (Mid-core) | 35–50% | 20–35% | 10–20% | Complexity impacts D1; loyalty drives D30 |
Understanding these benchmarks is only half the story—it is also crucial to grasp why players behave this way, which is influenced by emerging video game industry trends and how games adapt to player expectations.
Games that implement thoughtful video game localization often see improved retention across global markets.
Most games lose 70% of new players in the first week. We help studios close that gap with data-driven design changes, onboarding improvements, and engagement loops.
Player Behavior Patterns Behind These Metrics
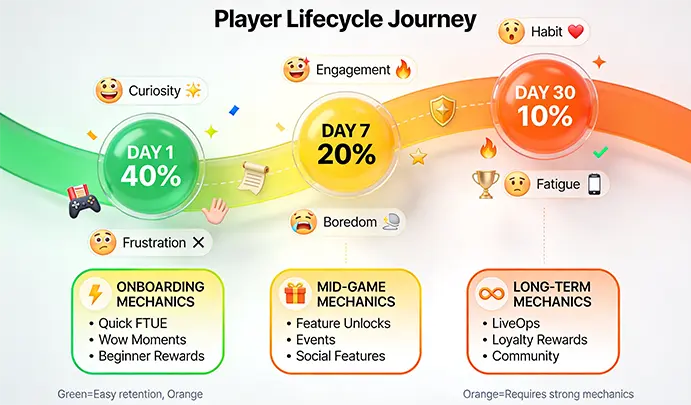
Each stage of the player lifecycle corresponds to different motivations and potential pitfalls. Understanding video game retention requires analyzing player psychology at every milestone.
Day 1: Curiosity vs. Frustration
On the first day, players are “trying the game on for size”. Downloads often happen on a whim, meaning any friction—such as excessive pop-ups or a tutorial that is too wordy—will result in immediate churn. Players who stay generally report that the game was “fun right away” or looked “promising”.
Day 7: Engagement vs. Boredom
By the end of the first week, two feelings emerge: engagement (“I am invested in progressing”) or boredom (“I have seen everything”). A high D1 and low D7 are major red flags; they suggest the game has initial appeal but lacks mid-game depth or meta-progression. Players who remain have usually found a pattern that fits their routine, such as daily quests or competitive ladders. Retention in games at this stage depends heavily on providing fresh challenges and content.
Day 30: Habit and Investment vs. Fatigue
At this stage, the game has become a habit. Players stay because they feel a sense of ownership over what they have built—their characters, their base, or their social standing in a guild. Those who churn at this point usually hit a “progress wall” where the game feels static, or the grind becomes too steep, lacking new excitement.
Mechanics That Move Each Metric
To improve retention, developers must translate behavioral insights into tactical design decisions. Modern game studios are increasingly leveraging AI in game development to predict churn patterns and personalize retention mechanics. Here are effective mechanics that encourage players to return, categorized by the stage they influence:
1. Onboarding Mechanics (Improving D1)
- Streamlined FTUE: Get players into the core gameplay within minutes. Use interactive tutorials rather than walls of text.
- Early “Wow” Moments: Introduce an exciting action sequence or a high-level power-up in the first five minutes to show the player what they can eventually achieve.
- Meaningful Beginner Rewards: Use positive reinforcement early to create a “win” state immediately upon joining.
2. Mid-Game Mechanics (Improving D7)
- Staggered Feature Unlocks: Do not overwhelm the player on Day 1. Unlock PvP on Day 3 and Guilds on Day 5 to keep the experience feeling fresh throughout the first week.
- Meta-Progression: Implement long-term objectives like skill trees or narrative chapters that give players a reason to look beyond the immediate core loop.
3. Long-Term Mechanics (Improving D30+)
- LiveOps & Events: Regular, time-limited events (e.g., holiday challenges) create urgency and “FOMO”.
- Social Obligations: Group mechanics like guild wars or co-op quests make players feel that their absence would affect others, creating a powerful social hook.
- Loyalty Streaks: Daily login bonuses that increase in value over time reward consistent engagement.
LiveOps: Keeping the Game Alive
LiveOps transforms games from static products into evolving services, directly addressing late-game churn by keeping games fresh long after core content is consumed.
- Regular Content Updates: Add new levels, characters, items, or features on a steady cadence. Even small updates rekindle interest. When players know something new is always coming, they have reasons to stick around.
- Time-Limited Events: Temporary events create urgency. Halloween events, weekend tournaments, and holiday challenges drive FOMO. Top-grossing games schedule events almost every weekend. By structuring gameplay around cycles — daily quests, weekly clan wars, seasonal rankings — games train players into habit loops.
- Personalization & Dynamic Offers: If a player has been inactive for 7 days, trigger a comeback reward. If telemetry shows a struggle on a level, dynamically offer a discount on a power-up. AI-driven analytics can identify when players are likely to churn and trigger interventions.
- Community Engagement: Regularly communicate updates, listen to player feedback, and run community contests. As players feel more connected to the game’s world and developers, they’re less likely to churn. Speedy customer support can turn frustrated players into loyal fans.
Common Mistakes Studios Make
- Treating Retention as an Afterthought: The biggest mistake is not considering retention until after launch. If the core loop and feature set don’t have built-in long-term engagement, no amount of post-launch patchwork fully saves it. Retention must be designed from the start.
- Chasing Vanity Metrics: Obsessing over D1 while ignoring D7/D30 leads to decisions boosting short-term logins at the expense of long-term depth. If D7 is low, don’t just pour more users into the funnel — fix the sieve.
- Not Understanding Why Players Churn: Metrics tell us that players churn, not why. Get into players’ minds: read reviews, conduct surveys, watch gameplay telemetry. Games that fail to understand players often double down on wrong features.
- Overloading Monetization Early: Forced account creation in the first session, excessive early ads, or constantly glowing shop icons create perceptions that games care more about revenue than players. Once trust breaks, players leave.
From push notification strategy to seasonal events and daily quests, Juego Studios helps you operationalize retention as a feature — not an afterthought.
How Retention Is Engineered in Production Pipelines
To master retention, it must be baked into development from day one, not treated as an afterthought.
Concept and Pre-Production
Define the core retention thesis early: “What will make players come back tomorrow?” Identify the primary retention driver—is it the narrative, the competition, or the collection?. Map out features for the first six months post-launch before the first line of code is even written.
Soft Launch and Iteration
Use a soft launch to measure actual D1, D7, and D30 on a small scale. A/B test different tutorial flows and reward schedules. If you find a “leak” at a specific level, use telemetry to identify if the difficulty spike is too high or the reward is too low.
Live Operations: The Service Mindset
LiveOps transforms a static product into an evolving service. By structuring gameplay around cycles—daily quests, weekly rankings, and seasonal updates—you train players into healthy habit loops. Modern analytics can even identify when a player is likely to churn, allowing you to trigger a “comeback reward” to re-engage them.
Conclusion
Retention is not magic; it is a discipline combining psychology, design, and analytics. By utilizing the MBBM framework, studios can stop guessing why players leave and start engineering reasons for them to stay.
Successful games are built on a foundation of measuring the right metrics, benchmarking against the right peers, and implementing mechanics that respect player behavior. When you focus on crafting player-focused experiences, you don’t just increase your numbers—you build a loyal community that sticks with you for the long run. At Juego Studios, we help studios craft experiences that keep players coming back.
For teams looking to strengthen their retention infrastructure, specialized game development services can help implement the LiveOps and analytics pipelines necessary to keep players engaged.
Frequently Asked Questions
The three core retention metrics are D1 (Day 1), D7 (Day 7), and D30 (Day 30) retention rates. D1 measures first impression strength, D7 gauges mid-term engagement, and D30 indicates long-term hooks. Additionally, track DAU/MAU ratio, session frequency, and churn points.
Good retention varies dramatically by genre. Hyper-casual games typically see 20-30% D1 and under 2% D30, while simulation games can achieve 45-60% D1 and 20-30% D30. Always benchmark against your specific genre rather than industry averages for meaningful comparisons.
LiveOps keeps games fresh through regular content updates, time-limited events, and personalized offers. Professional LiveOps services help studios implement event calendars, dynamic player engagement, and community management that transform games from static products into evolving experiences players return to regularly.
High D1 but low D7 signals an initial appeal without mid-game depth. Common causes include content exhaustion by days 3-5, lack of meta-progression systems, repetitive gameplay without variety, or difficulty spikes. Players need new features, challenges, and goals throughout the first week.
Related Posts

Top 10 Game Development Companies in Gurgaon (Gurugram)
Gurgaon has quickly evolved into a high-output game production hub, with studios building everything from mobile-first titles and real-money platforms to multiplayer and live-service games for global markets.

Top Game Development Companies in 2026: 10 Global Leaders Compared
Most game projects don’t fail because the idea was weak. They fail because the development partner couldn’t scale, adapt, or deliver when pressure peaked.
Best Game Development Companies in India [2026]: Reviewed & Compared
Finding the best game development companies in India has become less about availability and more about judgment. With studios offering everything from mobile games to complex multiplayer and immersive experiences, the real challenge is understanding who can consistently execute at a high level.